

ENVIRONMENTAL DASHBOARDS
Visualizing Sustainability in Numbers
Explore the Environmental Future in Real Time - A Visual Journey through Sustainability and Sanitation Indicators
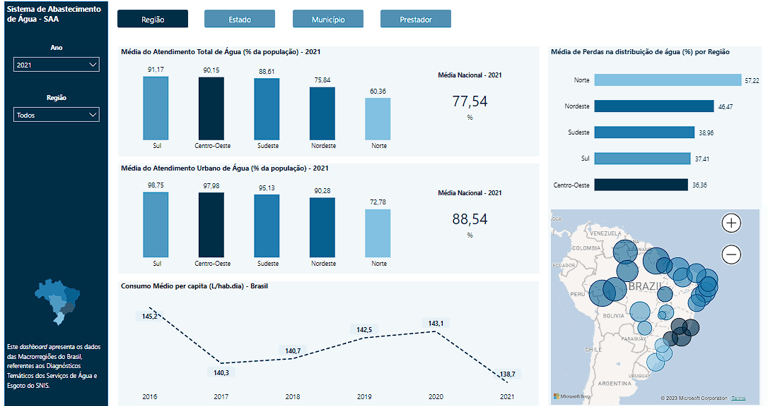
Water Supply System
The Water Supply System Dashboard has been meticulously crafted from SNIS data, covering the last five years of diagnostics. This panel provides an engaging overview of the system's evolution, highlighting not only the national landscape but also macro-regions, states, municipalities, and the involved service providers. Explore the nuances of progress and uncover the stories behind the numbers in this powerful visualization tool
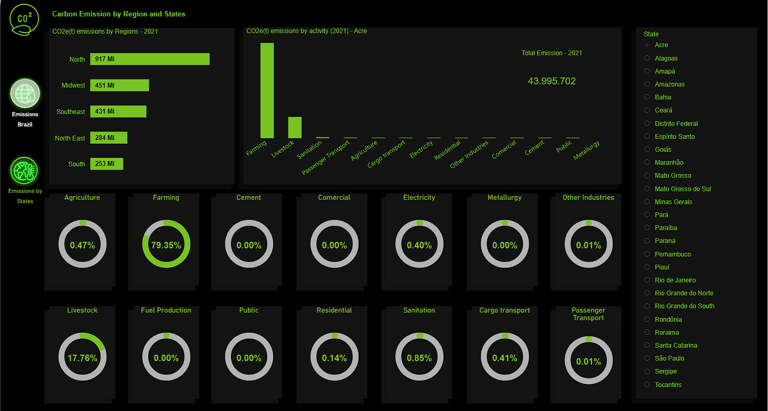
CO2 Emission by activity in Brazil
Discover everything about CO2 emissions in Brazil with our amazing Emission by Activity Panel! It uses data from the SEEG (Greenhouse Gas Emission Estimate System) to showcase emissions from 1990 to 2021. See how Brazil and the states perform in different activities. Explore the information effortlessly and understand how each place contributes to our sustainable future.
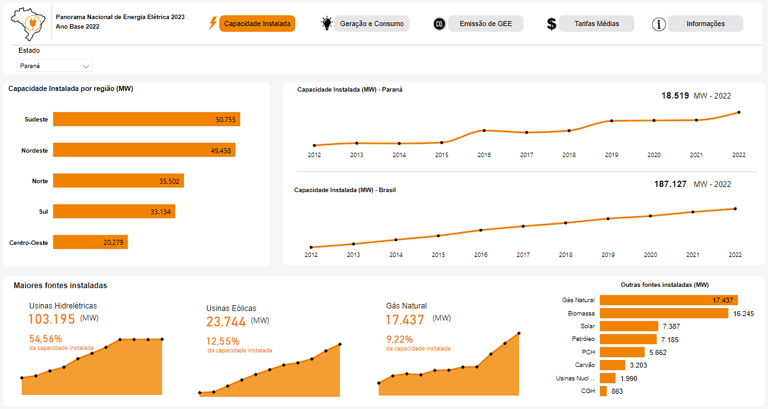
National Electricity Overview
Explore the amazing 2023 National Electric Energy Overview Dashboard, created with data from the Statistical Yearbook of Electric Energy! Here, you can dive into information in an easy and engaging way. Visualize the installed capacity in Brazil by region and state, discover the main sources of energy, track the evolution of generating sources since 2012, and explore consumption by consumer type in the country.
Additionally, check out greenhouse gas emissions by system and source, learn about average tariffs in Brazil and regions, detailed by consumption class. And to top it off, explore the tariff ranking by distributor. An electrifying journey behind the scenes of electric energy in our country!
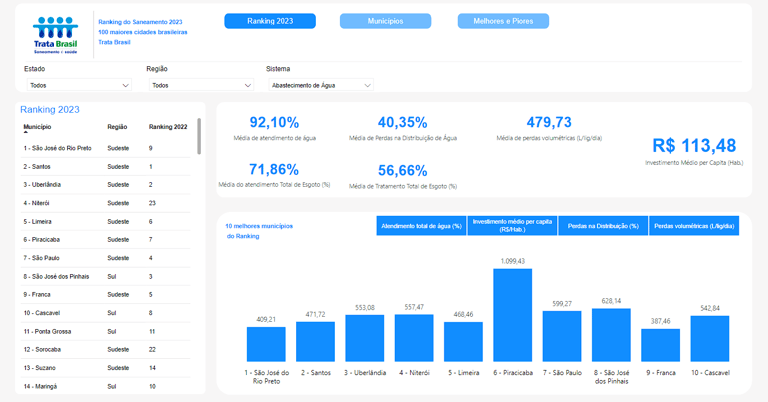

Sanitation Ranking 2023 Trata Brasil Institute
Explore the sanitation landscape in the 100 largest cities in Brazil with the 2023 Sanitation Ranking from the Trata Brasil Institute. This detailed study reveals crucial insights into the effectiveness of implemented measures, providing a valuable overview of the current state of sanitation in the country. Access the information on the platform and drive essential improvements in quality of life and sustainable development.
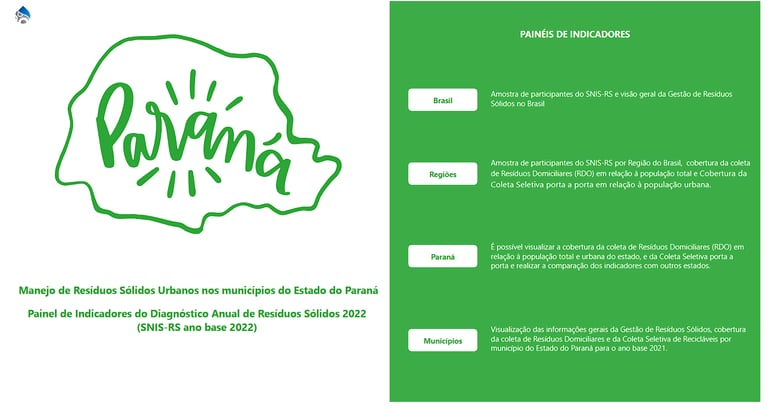
Explore our Waste Management Dashboard in Paraná. View SNIS-RS data, coverage of household and selective waste collection by municipality in 2021.
For SNIS-RS 2023 data (Base Year 2022), please contact us.